


After the Great Lockdown comes the slow and staggered reopening in North America, the European Union, and parts of Asia. This should also mark the peak in economic contraction as all those downward sloping charts of economic indicators over the past couple of months should stop looking like downhill ski slopes and start to form a bottom. This does not mean that the data will stop being shocking, since the incoming data lags the economic activity on the ground. Case in point will be the employment data this Friday, where the unemployment rate will probably be north of 15% in both Canada and the US. The data will slowly get better as economies slowly restart.
A useful analogy is being at a traffic light behind 20 stopped cars. Prior to COVID-19, you would be able to get through the traffic light easily. However, now the light will change from green to red before your car begins to move. It may take several light changes before you get through the intersection.
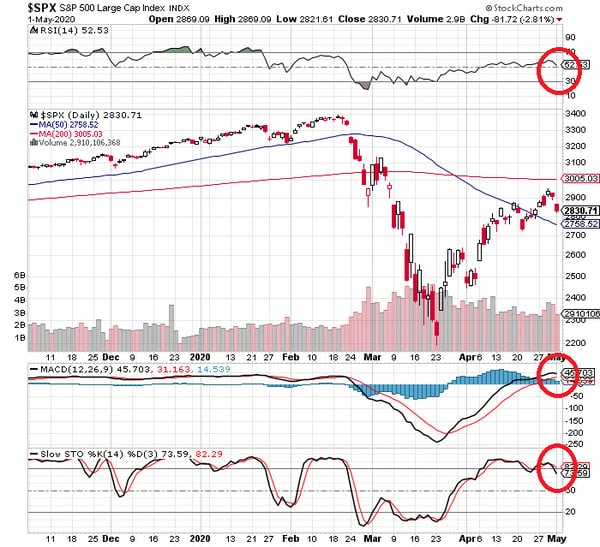
Under this slow reopening scenario, does it make sense for equity markets to be about 10% below their pre-outbreak highs? Or should investors heed that well-known finance adage: "sell in May and go away"? The saying is based on the historical underperformance of some stocks in the "summery" six-month period commencing in May and ending in October, compared to the "wintery" six-month period from November to April. Monthly S&P data compiled from 1928 shows an average November – April return of 5.1%, versus just 2.1% for May – October.
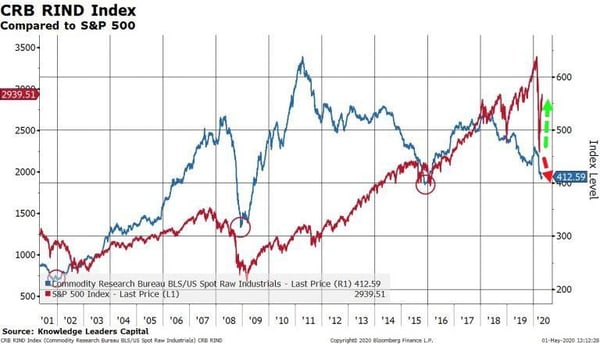
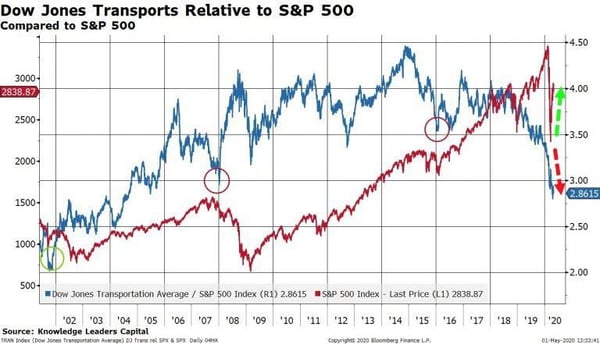
Another compelling reason is the fact that both the commodities and transports indices are underperforming the S&P 500. Both indices have typically bottomed during bear markets in price well before stocks have bottomed during bear markets. This was the case in 2001, 2008, and 2015. This divergence is warning that this bull market may not be over.
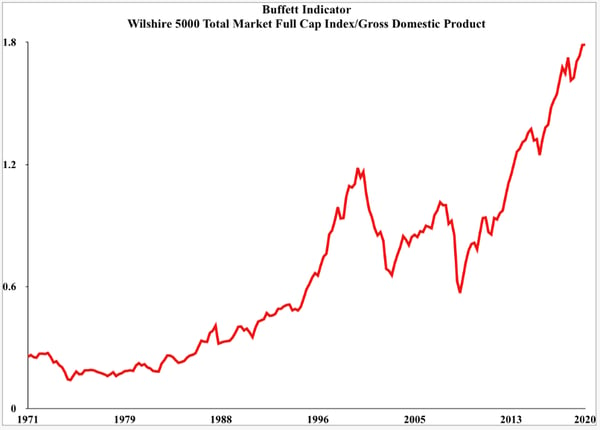
Not convinced? How about taking advice from the most successful long-term investor of all time, Warren Buffet. His favourite stock-market gauge hit a record high, signaling that stocks are overvalued and that a crash could be coming.
"It is probably the best single measure of where valuations stand at any given moment," Buffett wrote in a Fortune magazine article in 2001.
The so-called Buffett indicator takes the combined market capitalizations of a country's publicly traded stocks and divides it by quarterly gross domestic product. Investors use it to gauge whether the stock market is overvalued or undervalued relative to the size of the economy.
I guess it should not surprise us that on Friday, Buffett’s Berkshire Hathaway announced that it had liquidated the entirety of its equity position in the US airline industry which included $6.5 billion worth of stock in United, American, Southwest and Delta Airlines. Thus, unlike 2008, Buffett has not only stopped buying any stocks, despite major "bargains", but has been aggressively liquidating his holdings; hardly a ringing endorsement for the “bear market is over” crowd.
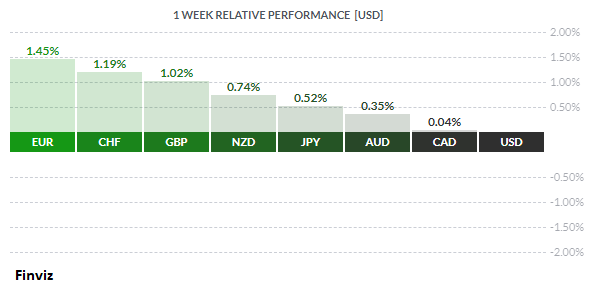
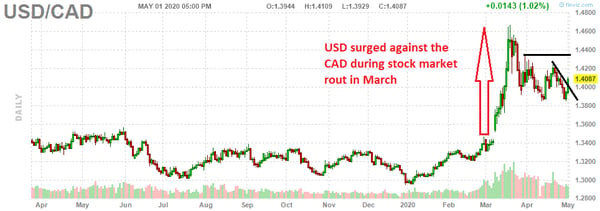
So why am I pointing out that the stock market may be ready to resume its plunge in this currency blog? Because during equity market stress some currencies are most sensitive to shifting risk sentiment. Therefore, during stock market unrest, the CAD, GBP, AUD, and NZD will tend to fall against the USD while currencies that have negative interest rates like the EUR, YEN, and CHF will tend to rise.
The CAD, for instance, was hit hard during the stock market turmoil in March. When markets rebounded, the CAD was able to recapture some of its losses despite the hit on oil prices. In the daily chart, the USD/CAD rate has broken up through the down trending line from April 21st. If it can break above 1.4250, then an assault on the March 19th high of 1.4373 would be in the cards.
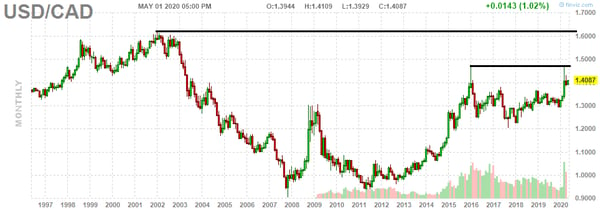
On the monthly chart, if it breaks above the January 2016 high of 1.47 then there is not much resistance to the 1.60 level of 2002 – 2003.
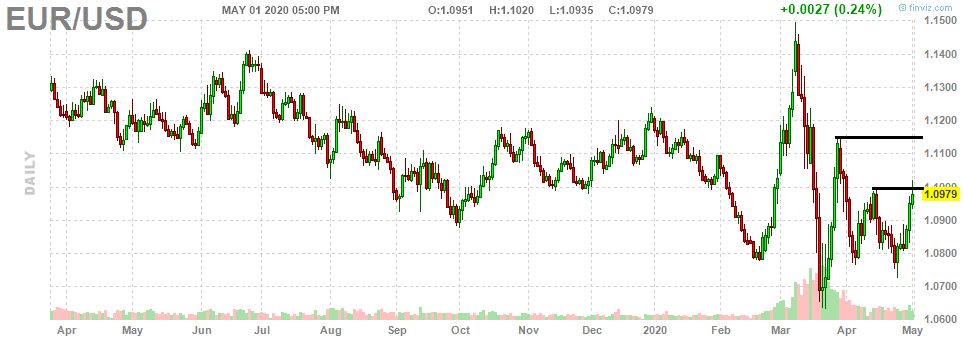
For the euro, the opposite happened: the euro rose against the USD during March’s stock market upheaval. This is counterintuitive, as the euro rose due to the negative interest rate environment in Europe as investors would borrow the euro to fund carry trades to earn a low-risk profit. As the market plunged, those carry trades were closed, and the euro was bought in order to repay the euro loans.
With the advent of May, the warmer weather and the flattening of the curve should give way to the gradual easing of lockdowns.
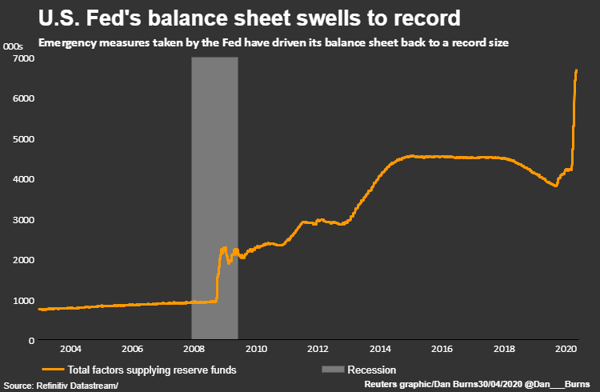
Speaking of flattening the curve, there is one curve that won’t be flattened anytime soon. The US Federal Reserves’ balance sheet is equivalent of more than 31% of the size of the US economy and will certainly grow larger in the weeks ahead. The consequences of this is a discussion for another day.
Finally, there is news hinting that President Trump may restart the trade war with China, seeking to hold China responsible for the coronavirus. We will have to wait and see if these rumours hold true in the weeks and months to come.
Key Data Releases This Week
Would you like to receive all of our blog posts directly to your inbox? Click here to subscribe!

|
by Tony Valente Senior FX Dealer, Global Treasury Solutions |
|||


