


The Numbers Don't Lie...
FinViz
…but they can be subject to interpretation. Since the official declaration of the COVID-19 pandemic in March, fundamental measures of the economy (such as joblessness, inflation, retail sales and the like) have been largely ignored. The recently ended second quarter of 2020 was such an unmitigated economic disaster that the aforesaid metrics were, frankly, meaningless. However, we are now into Q3 and it appears the worst may be behind us (or so we hope). Given the well-publicised run-up in equity prices since the market bottom in late March, and the stock market’s function of discounting future events, perhaps we should start looking for some of the so-called “green shoots” of economic recovery.
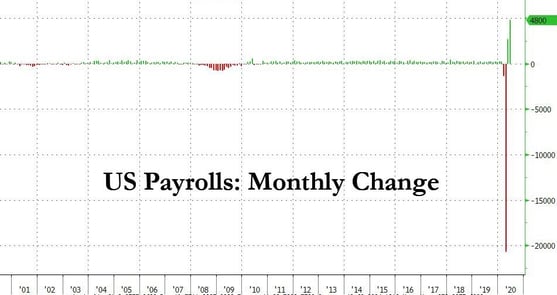
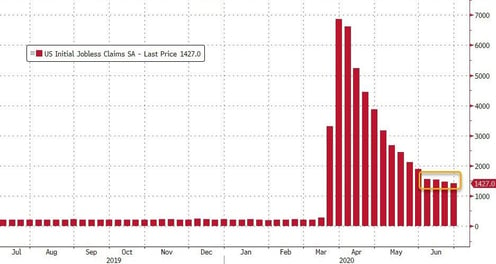
The top metric for gauging the health of the American economy is obviously jobs and the jobless rate. Analyst predictions for the June jobless rates had been difficult to make, with re-openings and then rollbacks playing havoc with employment numbers. As a consequence, even dropping the top and bottom 10% of calls still left a range of 1.65 mil to 5.0 mil jobs, reflecting the tremendous uncertainty amongst market players. On Thursday morning, the numbers were released and took the market by surprise, showing a rise of +4.8 mil jobs, well above the consensus call of +3.0 mil jobs and topping the upwardly-revised May figure of +2.7 mil jobs (previously +2.5 mil).
- Labour force Participation Rate rose to 61.5% from the prior month’s 60.8%
- As lower-paid workers are recalled from furlough, monthly wage increases declined from +6.6% to +5.0%, a more typical range
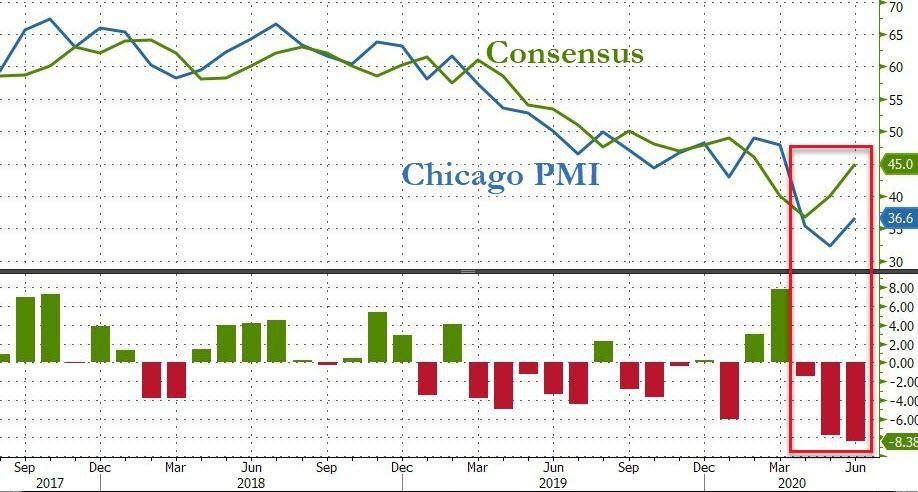
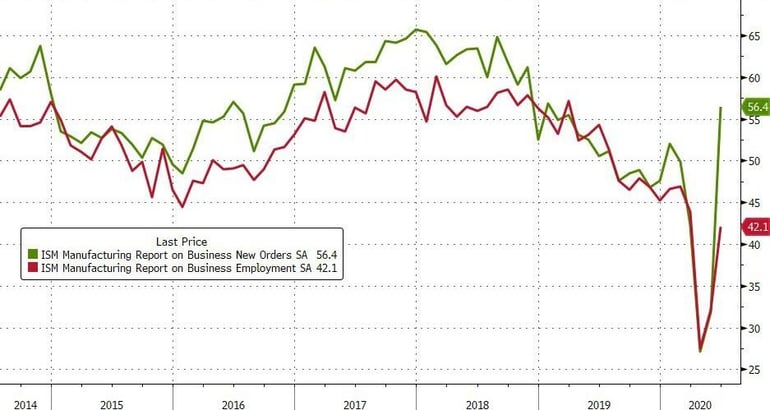
Last week also saw the release of key regional and national manufacturing indices. The Chicago PMI emerged at just 36.6, well below the market call of 45.0 – which had implied a V-shaped bounce – and barely above the previous month.
Bloomberg
In contrast, national measures of American manufacturing showed a marked rise, with the Institute of Supply Management (ISM) June PMI index beating expectations at 52.6 vs the call of 49.5 and the previous month’s 43.1, a solid result. Employment lagged while new orders surged:
So how to interpret all this information? Going into Q3, it is worthwhile remembering the following:
- Massive fiscal stimuli from all governments are still in place, with the possibility of more spending should the recovery flag
- The Federal Reserve (along with other central banks) has made abundantly clear that it will back up the economy and do whatever is necessary to keep the expansion in train
- Pandemics are always a fleeting thing, otherwise we’d still be dealing with the Black Death
- The worst of the economic dislocation is now in the past
- Do you really want to bet against America and the American consumer?
- Even the fall election is between two known politicians, so there won’t be any surprises ther
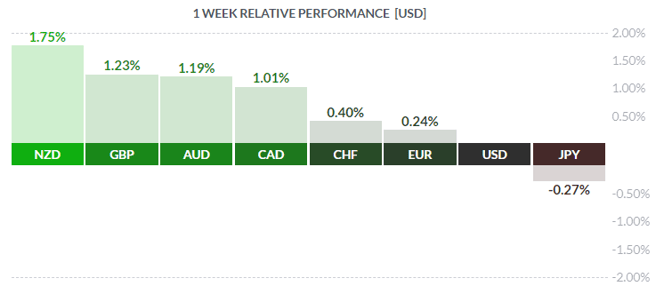
All of this adds up to: RISK ON. Mr. Market has continued to rally the equity markets while trashing the safe-haven US dollar which ended up the loser on the week, just barely beating out the hapless JPY.
***
In the True North, Canada April GDP was released, declining a record -11.6%, better than the consensus call of -12.2%, after a decline of -7.2% in March. StatsCan, perhaps realising that April 2020 was, in market optics, ages ago, released a “Flash Estimate” for May GDP, showing a rise +3.0% in the domestic economy. This would be consistent with April being the nadir of the slowdown and May showing the commencement of recovery – or initial response to all the spending by Ottawa over the past four months - or both. Take your pick.
For the week, the loonie picked up some ground against a weakening greenback, as investors bought CAD in a risk-on move.
Canadian jobs numbers, which are usually (but not always) released coincident with US jobs numbers, will be out this coming Friday.
***
We will now take a look at gold, everyone’s favourite precious metal. Au has been on a tear recently, briefly trading through resistance around $1800 USD/oz. before settling down late in the week at the $1780 level. These were the highest prices seen since November 2011. The chart below is illustrative of gold’s recent behaviour.
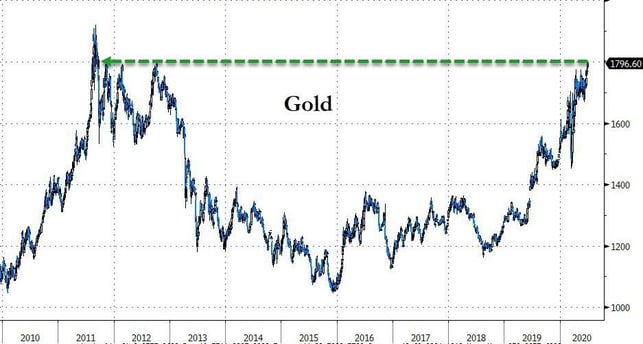
The triple top back in 2011/2012 represents significant resistance to any further advance by gold, but many factors are coming into play that may see a sharp rally in the metal price going forward:
- Deficit spending by national governments combatting the pandemic-induced slowdown
- Real interest rates (nominal less inflation) at negative levels- for example, US 10 year treasury bonds yield 0.68%; with inflation around 1.0 to 1.5%, true yield is negative
- Gold and other commodities trade inversely (most of the time) to the USD; with dollar depreciation forecast to continue, gold should rally in response
With reference to this last point, there is a strong correlation, in the range of 90%, between the total US monetary base (dollars that are, or can be, in circulation) and the price of gold. Or, in other words: more dollars equals a higher gold price. With vast deficit spending and currency debauchment by national governments and most central banks (no other way to describe it), and potential political upheaval in America in the event of a contested November election result (almost a certainty), gold appears poised to move higher.
The coming week has little scheduled in Canada until the jobless numbers on Friday morning, while America sees a sprinkling of secondary statistics along with some Fedspeak.
Key Data Releases This Week
| Forecast | Previous | |||
| MONDAY, JULY 6 | ||||
| 09:00 | USD | ISM Non-Manufacturing PMI | 50.0 | 45.4 |
| 23:30 | AUD | Cash Rate | 0.25% | 0.25% |
| 23:30 | AUD | RBA Rate Statement | ||
| TUESDAY, JULY 7 | ||||
| WEDNESDAY, JULY 8 | ||||
| THURSDAY, JULY 9 | ||||
| FRIDAY, JULY 10 | ||||
| 07:30 | CAD | Employment Change | 550.0K | 289.6K |
| 07:30 | CAD | Unemployment Rate | 12.5% | 13.7% |
 |
by DAVID B. GRANNER Senior FX Dealer, Global Treasury Solutions |
|||


