


Soft Dollar
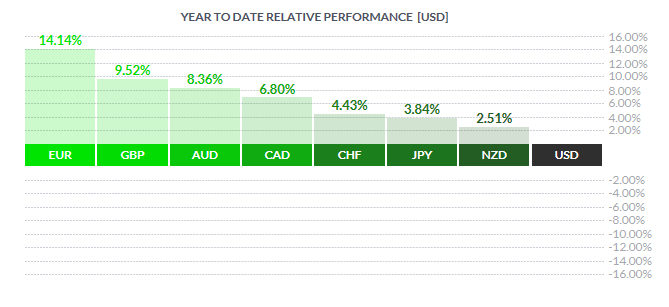
2017 was, by most accounts, to be the year for an enormous USD rally supported by pro-Trump policies, such as the border adjustment tax and tax reform, and diverging monetary policies. News flash, the rally never materialized. The border adjustment tax never got off the drawing board and the tax reform, which was finally agreed to and passed in December, ending up resembling a tax cut without any real reform. As for the driver of diverging monetary policies – the Federal Reserve did manage to hike interest rates three times by 75bp under the backdrop of stronger growth and low unemployment but, as the year wore on, it became apparent that other central banks were also changing gears. The Bank of Canada, for one, did manage to surprise the market with not one but two consecutive 25bp interest rate hikes in the summer. All in all, this caused the USD to underperform every major currency in 2017.
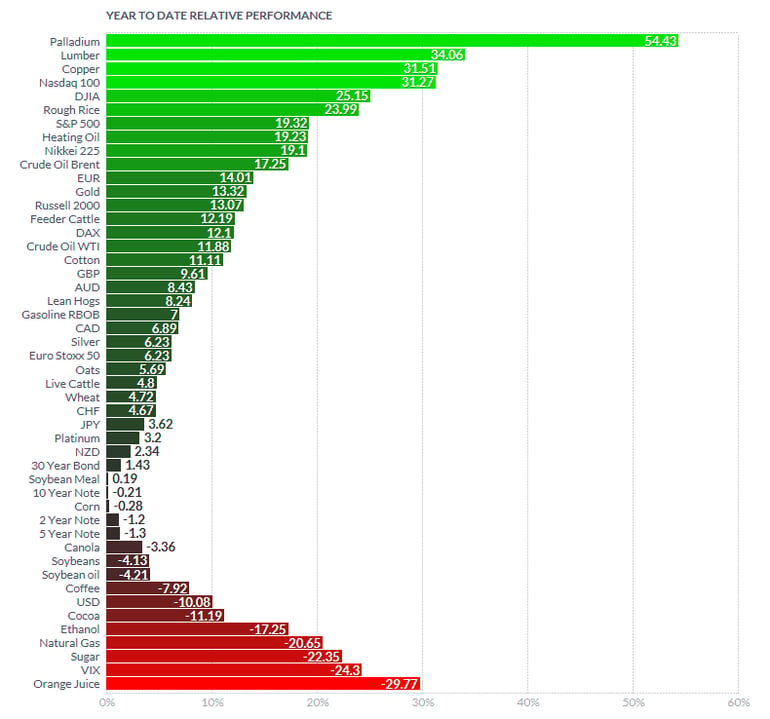
To emphasise how badly the USD underperformed, we decided to put up a chart of the year to date relative performance of the future markets for 2017. Notice that USD only managed to outperform 6 components and was outpaced by 41 others. The chart may also be forecasting that commodity inflation may be the story of 2018, as higher commodity prices begin to trickle down into higher producer prices followed by higher consumer prices. The chart also highlights the synchronized global growth of 2017, which has increased demand for industrial commodities.
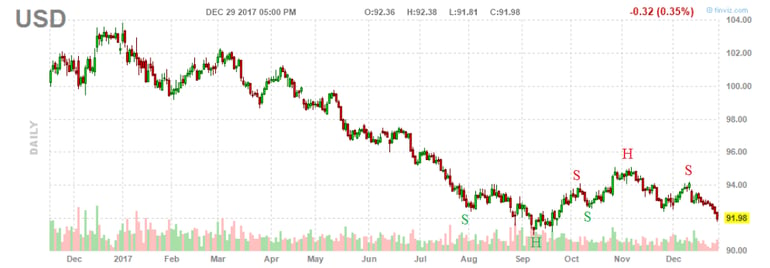
The US dollar index fell from the beginning of 2017 all the way to September, where it attempted to carve out a head and shoulder bottom. That reversal pattern was only able to muster a rally for two months before forming a head and shoulder topping pattern for the balance of the year. The USD was aggressively sold down in the month of December but, please note, that December moves are fraught by low liquidity and cannot be relied on for proper analysis. Furthermore, key market players probably will not return to action until after the first week of January. Having said this, the one year chart of the dollar index looks rather bearish.
The other big story last week was the breakthrough in the Brexit negotiations. Finally, after countless fits and starts, the UK and the EU have agreed on a divorce settlement. The three remaining stumbling blocks were the rights of EU and UK citizens, the Irish border, and the monetary divorce payment. I’m going to be a little cynical here, but with the UK agreeing to pay the EU around 45 billion euros, the EU miraculously found a way to compromise on citizen rights and accept a pledge from the UK to provide specific solutions to address the unique situation of Ireland and a promise that, in the absence of an Irish border deal, the UK will maintain full alignment with the single market and customs union. I guess “money talks” and the EU has decided that "sufficient progress" has been made in order to advance the negotiations to the next level – the trade agreement.
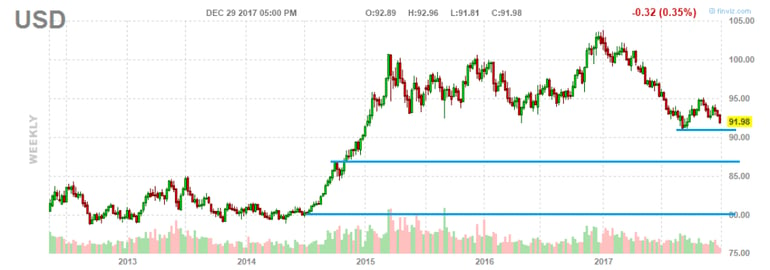
A look at the weekly chart shows how much of a predicament the dollar index really is. If the dollar doesn’t dig its heels in soon it could be on the precipice of a much bigger fall.
We can’t remember a new year with so many geopolitical concerns ahead of it:
- Germany Has been unable to form a government since the September elections.
- Federal elections in Italy are slated for March 4th.
- Catalonia's separation movement from Spain received a shot in the arm by winning a majority in December elections and will take office January 17.
- Poland and the EU are at odds – the EU objects to the government's judicial reforms, which undermines the independence of the courts. Poland wants the EU mind its own business, especially when it comes to accepting refugees – sound familiar, think Brexit.
- 2018 will be the start of the trade negotiations for post Brexit and the transition period after the end of March 2019.
- The Trump administration will switch its focus to infrastructure initiatives.
- NAFTA negotiations continue at a slower pace than President Trump would like.
- China and USA trade tensions may be set to escalate after the US formally told the World Trade Organization that it opposes granting China market economy status, a position that if upheld would allow Washington to maintain high anti-dumping duties on Chinese goods.
- North Korea’s nuclear capabilities continue to be unanswered and a solution appears unreachable.
Interestingly, the first four on the list above are euro negative; however, the euro has risen despite these obstacles. This only demonstrates how vulnerable the USD has been. One factor, which may be playing a role, is President Trump’s push for higher exports as well as his explicit comments against a strong dollar. We think that it is no coincidence that the dollar has weakened substantially since President Trump’s inauguration.
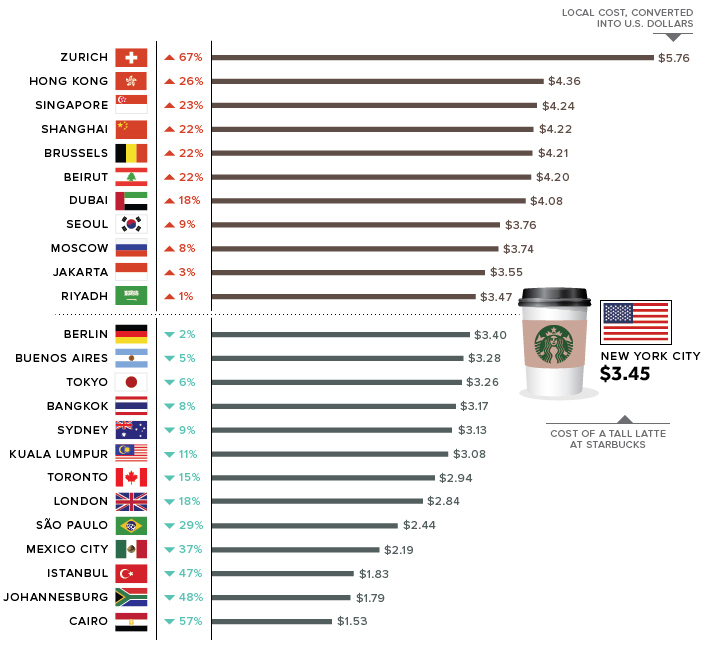
And now for something more practical – The Wall Street Journal developed the “Latte Index”, which uses purchasing-power parity (PPP) – comparing the cost of the same good in different countries – to estimate which currencies are overvalued and undervalued. In this case, the WSJ tracked down the price of a tall Starbucks latte in dozens of cities around the world. These prices are then converted to US dollars and compared to the benchmark price, which is a tall Starbucks latte in New York City (US$3.45).
Judging by this chart, a latte in Toronto, Canada is about 15% under the benchmark price of New York City. Interestingly, different organizations such as BIS, OECD, CFR, and the IMF have the CAD at being up to 10% undervalued – which puts the Latte Index not too far off the mark. Given the wide range of estimates that exist for currency values, using the relative cost of a cup of coffee might be as good of an alternative as any.
Key Data Releases This Week
| Forecast | Previous | |||
| MONDAY, JANUARY 1 | ||||
| TUESDAY, JANUARY 2 | ||||
| 04:30 | GBP | Manufacturing PMi | 58.0 | 58.2 |
| WEDNESDAY, JANUARY 3 | ||||
| 04:30 | GBP | Construction PMI | 54.1 | 53.8 |
| 10:00 | USD | ISM Manufacturing PMI | 58.3 | 58.2 |
| 14:00 | USD | FOMC Meeting Minutes | ||
| THURSDAY, JANUARY 4 | ||||
| 04:30 | GBP | Services PMI | 54.1 | 53.8 |
| 08:15 | USD | ADP Non-Farm Employment Change | 192K | 190K |
| 08:30 | USD | Unemployment Claims | 244K | 245K |
| 11:00 | USD | Crude Oil Inventories | -4.6M | |
| 07:00 | GBP | MPC Official Bank Rate Votes | 0-0-9 | 7-0-2 |
| FRIDAY, JANUARY 5 | ||||
| 05:00 | EUR | CPI Flash Estimate y/y | 1.4% | 1.5% |
| 08:30 | CAD | Employment CHange | -2.5K | 79.5K |
| 08:30 | CAD | Trade Balance | -1.3B | -1.5B |
| 08:20 | CAD | Unemployment Rate | 6.0% | 5.9% |
| 08:30 | USD | Average Hourly Earnings m/m | 0.3% | 0.2% |
| 08:30 | USD | Non-Farm Emplyoment Change | 189K | 288K |
| 08:30 | USD | Unemployment Rate | 4.1% | 4.1% |
| 10:00 | USD | ISM Non-Manufacturing PMI | 57.8 | 57.4 |
 |
by TONY VALENTE Senior FX Dealer, Global Treasury Solutions |


