


Humdrum Blues
'Summertime and the livin’ is easy…’ And quiet too, with the doldrums hitting full force last week. Nonetheless, markets continued their task of pricing and discounting the future with a number of key statistics released at the end of last week.
The key number, of course, was American July non-farm payrolls, which actually surprised with a touch of unexpected strength. The headline number came out at 4.3% as expected and represented a 16-year low, but total jobs created outdid the call, coming in at +209K versus analyst’s consensus of +180K. Even better was the net revision of the previous two months at +2K; admittedly not a huge gain but not a downward revision either. Investors liked the numbers and rallied the greenback in response. This was in sharp contrast to earlier in the week, with Chicago PMI missing (56.9 vs call 60.0); ISM Manufacturing missing (56.3 vs call 56.6 – not that bad); and the ADP Employment Index coming up short as well (+178K vs call +190K). The USD had continued its fall out of favour during much of the week, but Friday’s numbers provided a much-needed tonic.
In the True North, employment stats were, on balance, not too bad either. Although the headline rate declined to 6.3% (call 6.5%), still the economy created a good chunk of full-time jobs. (A declining jobless rate often indicates frustrated jobseekers giving up their search for work, thus dropping out of the denominator). The net number of jobs created was +10.9K versus the call of +19.0K, but the split was +35.1K full-time and -24.3K part-time – an excellent outcome. What did hurt the loonie was a jump in the trade deficit: -3.6 bln versus call of -1.3 bln. The days of Canada running huge trade surpluses is now a distant memory.
In previous newsletters we had mentioned concern at the Bank of Canada, and elsewhere, about the Canadian housing market and, in particular, the Toronto housing market, in recent months the strongest in North America.
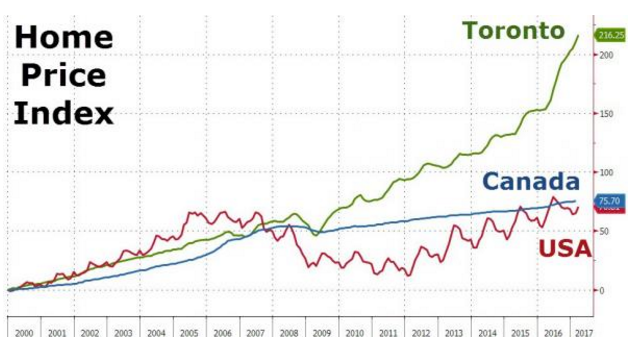
A touch strong, no?
Despite a seemingly general belief among Toronto homeowners – and, in all fairness, many others - that ‘real estate always rises’, long-dormant market forces re-asserted themselves and caused a well-overdue correction to commence. How long this downward bounce will continue is anyone’s guess, but a similar downturn occurred in 1990 and prices did not recover for almost fourteen years.
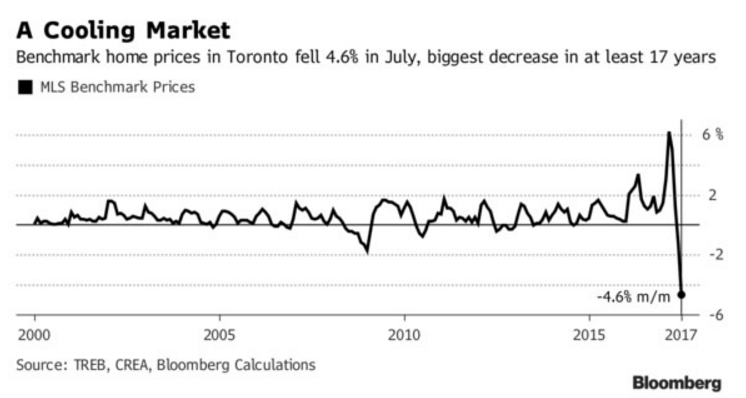
This doesn't look good
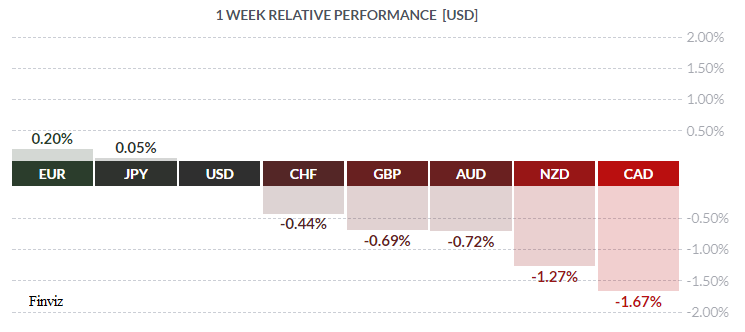
From the perspective of the Bank of Canada, collapsing home prices and the subsequent knock-down wealth effect does not augur well for the Canadian economy. Home construction represents a significant proportion of Canada’s GDP, employing over a million workers directly and indirectly (more than oil & gas and manufacturing combined) and weakness here has to be made up elsewhere; if not, then further rate hikes may be called into question. Bottom line: This isn’t exactly a bullish development for CAD. Neither is an increasing trade deficit, both of which largely explain why the loonie was the loser on the week.
Elsewhere, GBP rallied early in the week on expectation of a hawkish call by the Bank of England which ultimately failed to materialize last Thursday. The last Monetary Policy Committee vote had revealed an unexpected degree of hawkishness which investors thought might result in a measure of tightening on this go-around, but to no avail. The doves won out by 6 – 2.
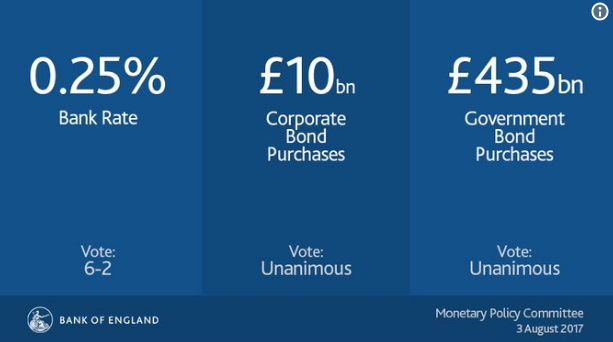
Mr. Market was quite disappointed and made his displeasure plain to all, wasting no time hitting sterling in response.
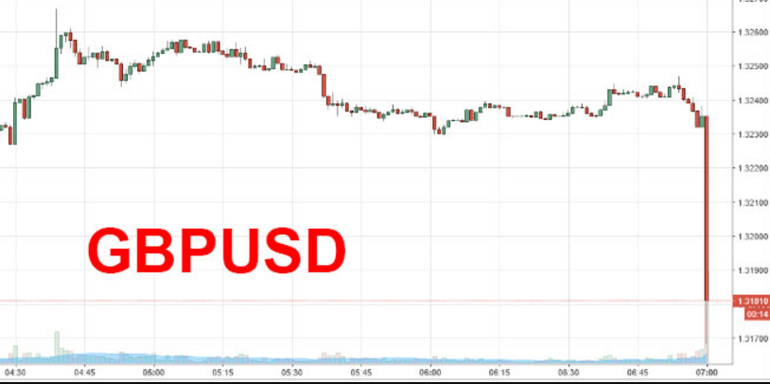
Don't mess with Mr. Market
We should take a brief look at oil. Despite all the histrionics coming out of OPEC and threats to cut supply and other attempts to manage the market, oil prices have traded in a remarkably tight range for quite some time now, roughly between $40USD/bbl and $53USD/bbl. Prices have been rising in recent weeks, however, in large measure due to a weakening USD, but rising prices are spurring an increase in supply – as predicted by Adam Smith and others. This rally may be short-lived.
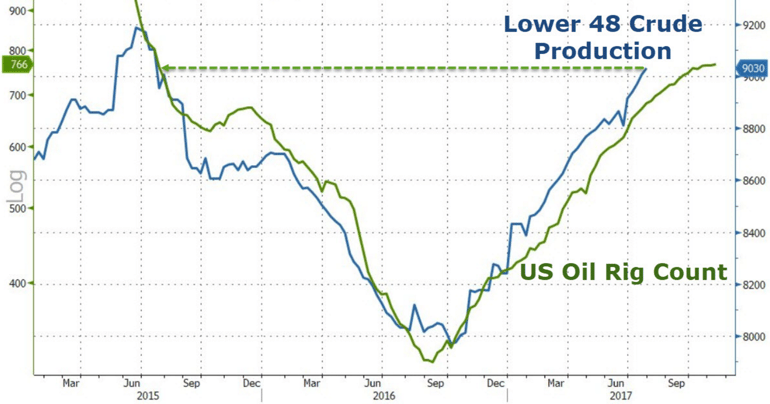
Demand begets higher prices begets more supply
The coming week sees a mixed bag of economic statistics as well as a couple of Fed speakers.

Summer Beckons
Key Data Releases This Week
| Forecast | Previous | |||
| MONDAY, JULY 31 | ||||
| TUESDAY, AUGUST 2 | ||||
| WEDNESDAY, AUGUST 3 | ||||
| 10:30 | USD | Crude Oil Inventories | -2.6M | -1.5M |
| 17:00 | NZD | Official Cash Rate | 1.75% | 1.75% |
| 17:00 | NZD | RBNZ Rate Statement | ||
| THURSDAY, AUGUST 4 | ||||
| 04:30 | GBP | Manufacturing Production m/m | 0.0% | -0.2% |
| 08:30 | USD | PPI m/m | 0.1% | 0.1% |
| 08:30 | USD | Unemployment Claims | 240K | 240K |
| 19:30 | AUD | RBA Gov Lowe Speaks | ||
| FRIDAY, AUGUST 5 | ||||
| 08:30 | USD | CPI m/m | 0.2% | 0.0% |
| 08:30 | USD | Core CPI m/m | 0.2% | 0.1% |
 |
by DAVID B. GRANNER Senior FX Dealer, Global Treasury Solutions |


