


Dots vs Votes
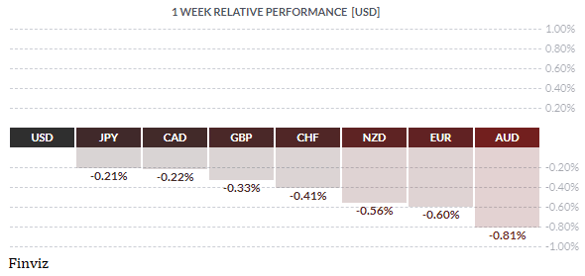
The one-week snapshot of the relative performance is a little deceiving because you can’t see Friday’s price action, which is laid out here:
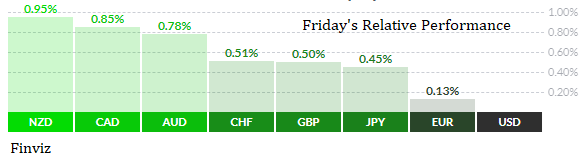
As you can see, Friday’s tape paints a different story. The USD was sold off on Friday, which will be a surprise to most, especially after the better-than-expected jobs report on Friday morning. The US economy added 850K jobs in June, which was better than the forecast of 720K. The previous month was upwardly revised by 24K to 583K. The labor force participation rate held steady at 61.6% and average hourly earnings grew at a 3.6% year-over-year. The only disappointing number was the unemployment rate, which rose to 5.9% from 5.8% but the market was expecting a drop to 5.6%. The bottom line is that the jobs report was viewed as a disappointment to USD bulls because it failed to bolster early Fed tightening bets.
So, what happened to those surprising hawkish Fed dots from two weeks ago? One thing to remember about the Fed dots is that each dot represents a Fed member, but not every dot is a voting member of the FOMC. This is an important distinction because while Fed members Bullard and Kaplan are very hawkish, they are not part of the voting committee. Meanwhile, six Fed members along with Fed Chair Powell and Vice-Chair Williams are doves and, of course, voting members. The members of the voting committee are all on the patient “wait and see” camp and will govern on consensus.
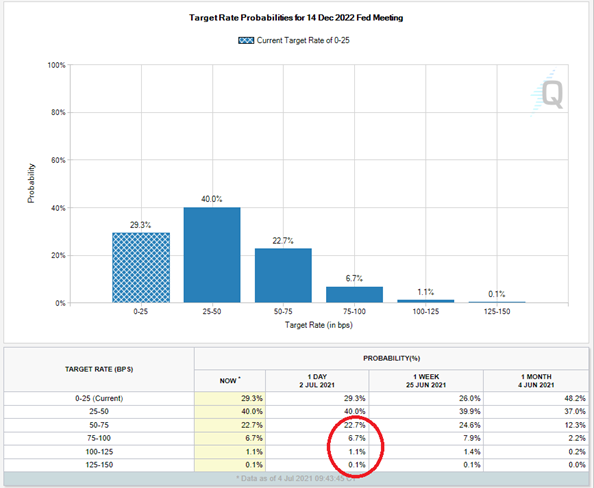
CME FedWatch
Interest rates have softened, so the bond market is confirming this dovish view by the core Fed voting members. As you can see from the CME FedWatch Tool above, the market has decreased its bets for more than one rate hike by the end of 2022 from the week before. This can be seen in the 10-year yield as well - it has fallen every day last week to approach the 1.40% level, which is the lower end of where it has traded over the last four months. Thus, as good as the employment report was, it is important to remember that it was the first employment report that beat expectations in three months and one great report doesn’t make a trend.
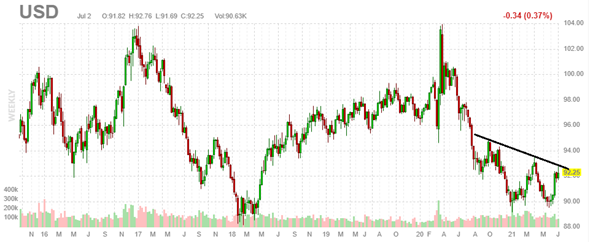
So, with the market buying into the transitory inflation story and a patient Fed this puts a massive headwind in front of the USD bulls. In the last dispatch, I highlighted the inverse head and shoulders formation that I was watching on the weekly chart of the US dollar index. It hasn’t broken it and it looks like the index has peaked for now.
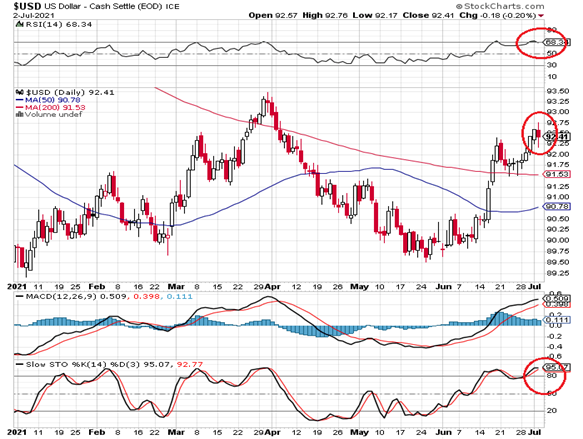
On the daily chart, momentum indicators are all pointing higher but are very extended. They look like they are ready to turn downward any day now. Friday’s price action also points to a potential reversal as an outside down day occurred where the candle had a higher high and lower low than Thursday’s candle.
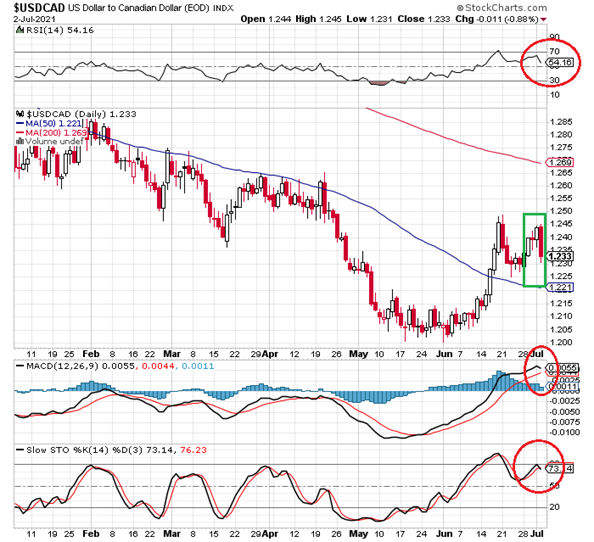
Interestingly, we had a outside down day in the USD/JPY and USD/CAD chart as well. Friday’s price action in the CAD was rather impressive as it recorded a higher high than Thursday’s candle and then proceed to take out the previous three day’s lows to record key reversal. Meanwhile, the momentum indicators have all turned down in the CAD’s favour.
I’m not suggesting that the USD has topped for the year. It looks like it has topped for now, but we may see a higher high later in the year, especially if the Fed tapers or interest rate rises get repriced sooner rather than later.
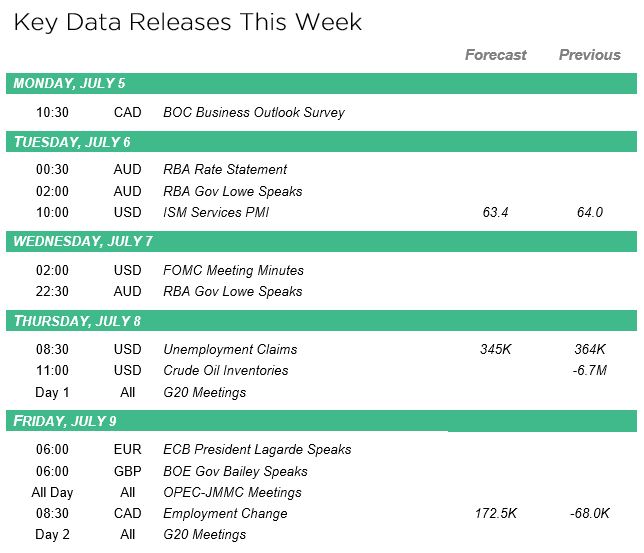
There are five key events in the week ahead to watch out for. In central banking we have the Reserve Bank of Australia meeting on Tuesday and the minutes of the last FOMC meeting on Wednesday. On Friday, we have China’s inflation report, employment date from Canada, and the G20 meeting.

|
by Tony Valente Senior FX Dealer, Global Treasury Solutions |
|||
Would you like to receive all of our blog posts directly to your inbox? Click here to subscribe!


